Gain complete operational visibility with AI-powered 2D/3D CAD visualization and interactive dashboards. Unlock instant insights through visual data analytics, automated pattern detection, and predictive trend mapping—achieving decisions 80% faster and driving $2.5M in operational savings.
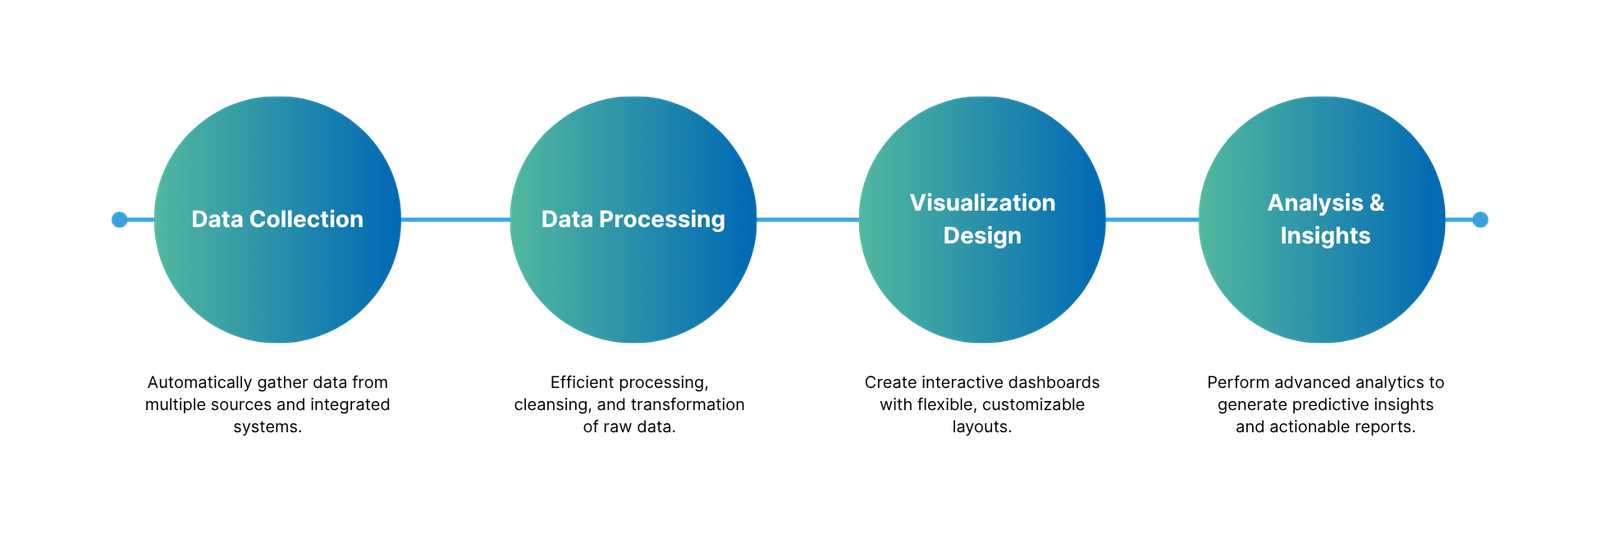
Seamlessly upload and view CAD files linked to assets and inspection points, complete with measurement tools.
Interactive Dashboards
Access real-time visualizations and operational insights with fully customizable dashboard widgets.
Custom Report Builder
Build reports with an intuitive drag-and-drop interface, auto-generated PDFs, and exportable logs.
Facility-Level Mapping
Explore floorplans, asset zones, and location-based routing powered by spatial analytics.
KPI Tracking & Trends
Monitor performance metrics and uncover trends through historical data analysis.
AI-Driven Operational Insights
Leverage AI analytics for pattern recognition, predictive modeling, and smarter decision-making.
Intelligence Excellence
Turn raw data into actionable intelligence with proven, measurable outcomes.
Accelerated Decisions
Speed up decision-making by 80% through intelligent insights and faster analysis.
Reduced Analysis Time
Cut data analysis cycles by 70% with AI-driven automation and real-time insights.
Enhanced Visibility
Expand operational visibility by 90% with advanced analytics and monitoring tools.
Stronger Collaboration
Boost collaboration by 75% with centralized platforms and shared intelligence.
Faster Reporting
Reduce reporting efforts by 60% with automated dashboards and smart reports.
Higher Productivity
Increase overall productivity by 65% through optimized workflows and data insights.
Command Lifecycle
End-to-end management of all stages in the command and control process
Advanced Analytics Technology
Cutting-edge technology for comprehensive data analysis and visualization.
CAD File Management
Upload, organize, and link CAD files to specific assets and inspection points
Real-Time Dashboards
Live operational dashboards with customizable widgets and drill-down capabilities
Data Visualizations
Advanced charts, graphs, and visual representations of operational data
KPI Tracking
Monitor key performance indicators with trend analysis and benchmarking
Location-Based Routing
Optimize routes and workflows based on asset locations and facility layout
Asset Zones
Define and manage asset zones with spatial relationships and floorplan integration
Technical Specifications
Engineered with enterprise-grade architecture for maximum reliability, scalability, and performance
Automated Scheduled Reports
Set up recurring report generation and distribution with flexible scheduling.
Comprehensive CAD File Support
Seamless handling of leading CAD formats such as DWG, DXF, STEP, and IGES.
Real-Time Data Processing
Instant processing with live dashboard updates and on-demand analytics.
Enterprise-Grade Security
Advanced encryption, secure storage, and role-based access controls for data protection.
Seamless API Integration
RESTful APIs enable smooth connectivity with existing CAD platforms and data systems.
Flexible Export Options
Generate PDFs, Excel sheets, and detailed logs with customizable export formatting.
Common Use Cases
CAD File Management
Easily upload, organize, and associate CAD files with specific assets and inspection points.
Operational Dashboards
Access real-time data visualizations and operational insights with comprehensive KPI tracking.
Facility Mapping
Visualize floorplans, manage asset zones, and optimize workflows with location-based routing.
Custom Reporting
Build reports with drag-and-drop tools, generating PDFs and exportable logs automatically.
Next-Generation Business Intelligence & AI-Driven Analytics
Discover the future of data visualization and business intelligence. This cutting-edge platform transforms analysis with AI-driven insights, predictive analytics, and immersive 3D visual experiences.
Vertical Cards - AI Compliance
AI-Powered Predictive Analytics
Use advanced AI to forecast trends, detect anomalies, and predict outcomes for data-driven decisions. This is an example of a longer description text to test the equal height feature across all cards.
Explore data through next-gen 3D rendering with VR/AR support for interactive facility walkthroughs.
3D renderingVR/AR supportInteractive explorationFacility walkthroughs
Real-Time AI Insights Engine
Continuous AI analysis provides instant insights, actionable recommendations, and automated decisions. This card has slightly more content for testing.